Cap Rates and Appreciation Trends in Santa Rosa Beach Real Estate
For real estate investors evaluating Santa Rosa Beach and the 30A corridor, two metrics ultimately determine long-term performance: cap rate (income yield) and appreciation (equity growth).
Unlike traditional rental markets, Santa Rosa Beach presents a hybrid coastal investment profile where appreciation often rivals or exceeds annual cash flow. Understanding how cap rates and price growth interact in this market is essential for investors building Emerald Coast portfolios.
This guide explains cap rate ranges, appreciation drivers, and total return dynamics for Santa Rosa Beach real estate in 2026.
Understanding Cap Rates in Coastal Markets
A cap rate measures net operating income (NOI) relative to property value:
Cap Rate = NOI ÷ Property Price
In pure income markets (Midwest rentals, multifamily cities), investors prioritize cap rate above all else.
Santa Rosa Beach differs because investors pursue hybrid returns:
-
STR income
-
Appreciation
-
Lifestyle value
-
Liquidity
This compresses cap rates compared to traditional rental markets.
Typical Santa Rosa Beach Cap Rates (2026)
Cap rates vary significantly by property type and location.
Beach-proximate condos:
4.5%–6%
3–4 bed 30A homes:
3.5%–5%
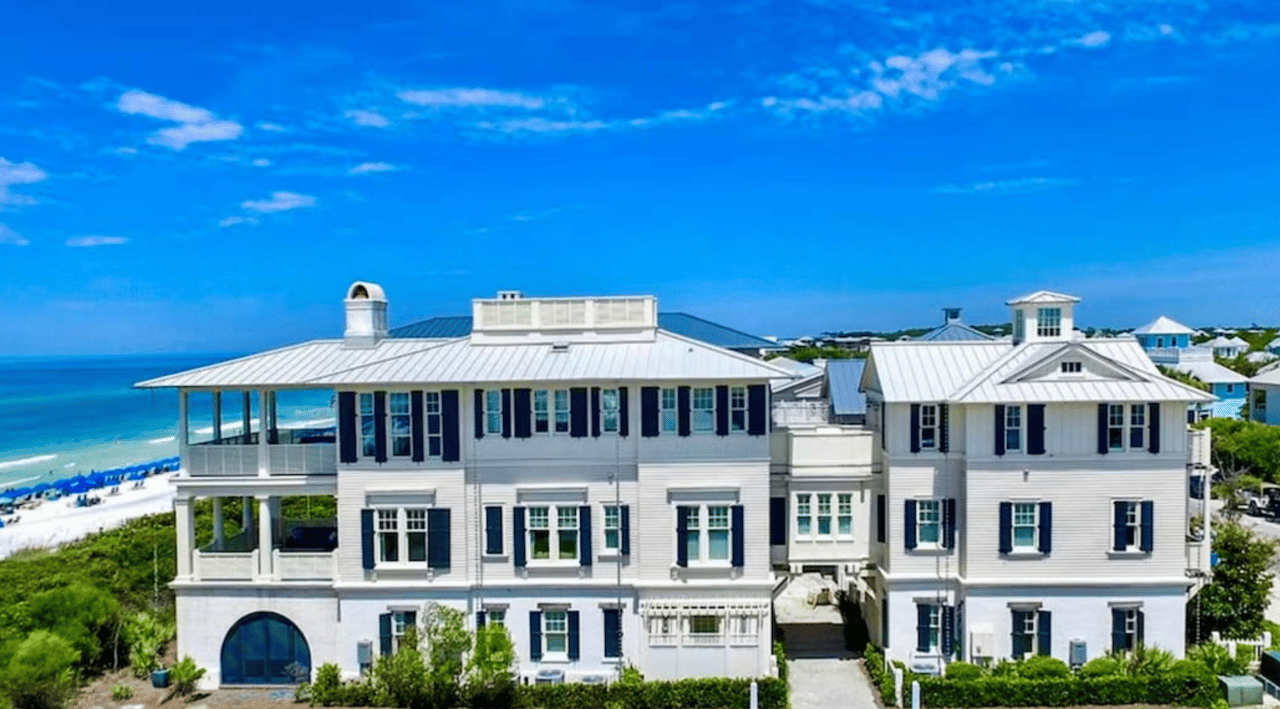
Luxury gulf-front homes:
2.5%–4%
Inland long-term rentals:
4.5%–6.5%
Several patterns emerge:
-
Closer to beach = lower cap rate
-
Higher price = lower yield
-
STR zones < LTR zones
-
Luxury < mid-tier
Despite lower cap rates, investors still compete aggressively for 30A properties due to appreciation expectations.
Why Cap Rates Are Lower on 30A
Several structural factors compress yields in Santa Rosa Beach.
1. Limited supply
Protected land and zoning restrict new coastal inventory.
2. High buyer demand
Second-home and lifestyle buyers compete with investors.
3. STR desirability
Vacation rental income potential drives pricing.
4. Prestige branding
30A functions as a luxury coastal brand market.
5. Appreciation expectations
Investors accept lower yield anticipating growth.
This dynamic resembles markets like:
-
Malibu
-
Hamptons
-
Charleston coast
Appreciation Trends in Santa Rosa Beach
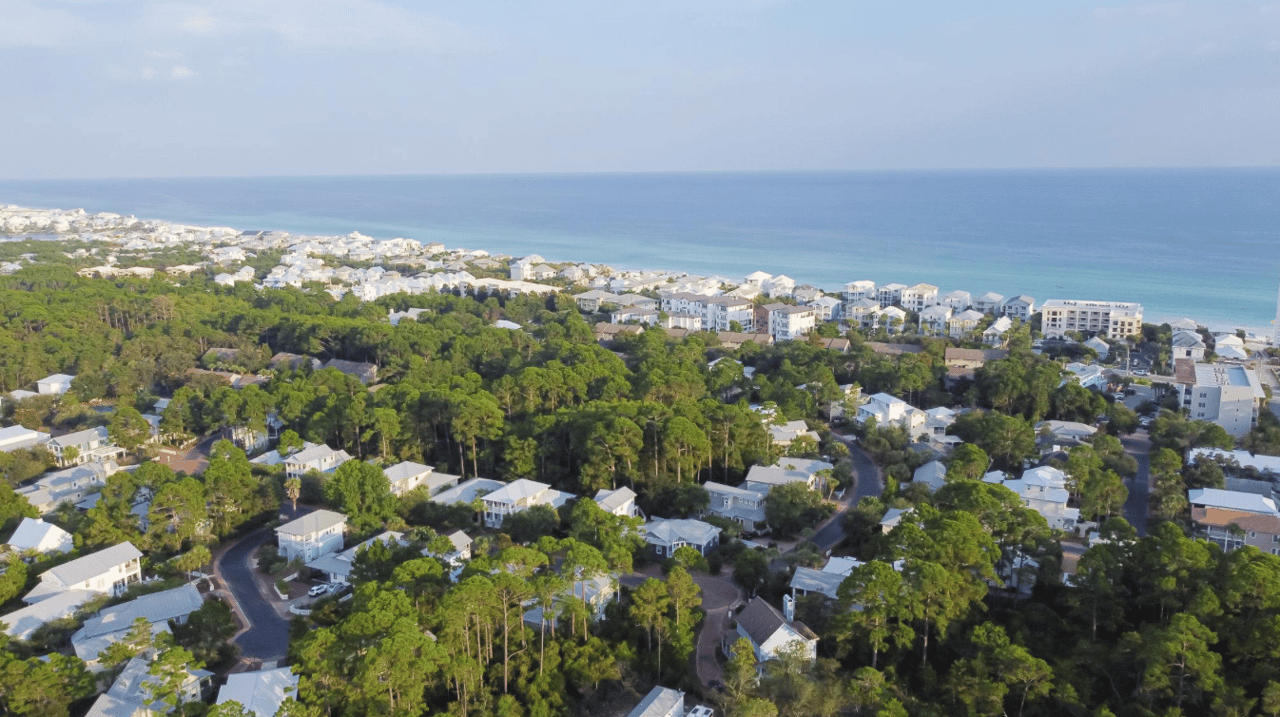
Santa Rosa Beach has historically outperformed many Florida coastal markets in appreciation due to structural constraints.
Key appreciation drivers:
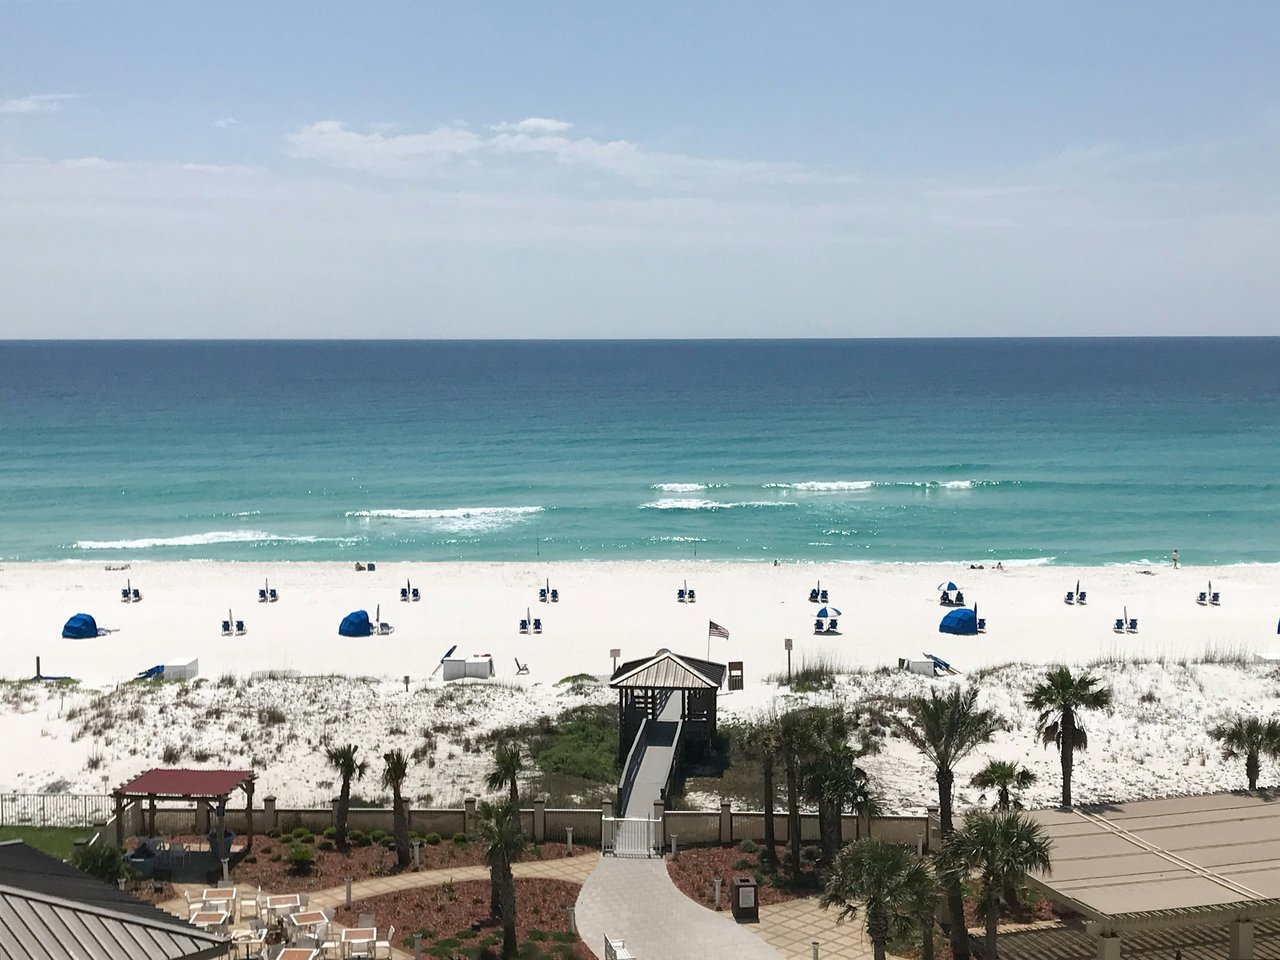
Supply scarcity
Limited buildable beachfront and 30A parcels.
Lifestyle migration
Remote workers and second-home buyers relocating.
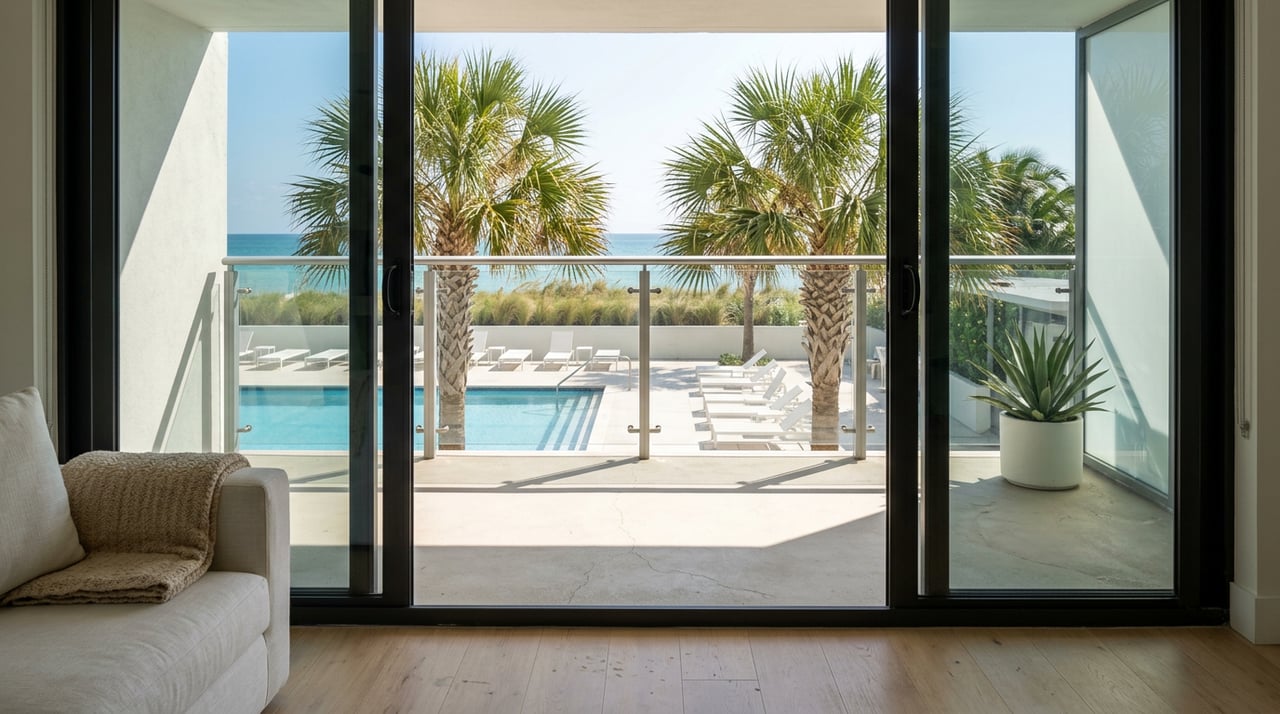
Tourism prestige
Affluent visitor base increases desirability.
Brand evolution
30A recognized nationally as luxury coastal destination.
Low density zoning
Maintains exclusivity and character.
Over long cycles, coastal scarcity markets tend to appreciate faster than high-density resort markets.
Total Return: Income + Appreciation
The most important concept in Santa Rosa Beach investing is total return.
Example 2026 scenario:
Purchase: $1.4M 30A home
Net STR income: $70K
Cap rate: 5%
Annual appreciation: 6% = $84K
Total annual return: $154K
Effective return: 11%
This illustrates why investors accept lower cap rates in Santa Rosa Beach — appreciation significantly enhances overall performance.
Cap Rate vs Appreciation by Property Tier
Different Santa Rosa Beach property types emphasize different return components.
Condos:
Higher cap rate, moderate appreciation
Mid-tier 30A homes:
Balanced yield + appreciation
Luxury coastal homes:
Low yield, high appreciation
Inland LTR homes:
Higher yield, steady appreciation
Sophisticated investors often blend these within portfolios.
Comparing Santa Rosa Beach to Other Florida Markets
Cap rates in Santa Rosa Beach appear lower than many Florida markets at first glance.
Typical coastal Florida cap rates:
Panama City Beach: 5%–7%
Daytona Beach: 6%–8%
Fort Myers: 5%–7%
Destin: 4%–6%
Santa Rosa Beach: 3%–6%
However, appreciation historically differs:
Santa Rosa Beach: High
Destin: Moderate–high
Panama City Beach: Moderate
Daytona: Moderate
Fort Myers: Cyclical
Total return often favors Santa Rosa Beach despite lower yield.
STR Cap Rate Nuances
Cap rates for short-term rentals require careful interpretation.
Factors affecting STR NOI:
-
Occupancy variability
-
Seasonality
-
Management fees
-
Cleaning costs
-
Marketing
-
Maintenance
-
Insurance
Two similar homes can produce very different cap rates based on micro-location and management quality.
This is why street-level analysis is critical.
Appreciation Outlook for Santa Rosa Beach (2026–2030)
Several forces support continued price growth.
Migration into Northwest Florida
Lifestyle relocations and second homes increasing.
Supply constraints remain fixed
Protected coastal land unlikely to expand.
Tourism demand stable
30A brand continues strengthening.
Luxury buyer expansion
Affluent coastal buyers entering market.
Rising replacement costs
Construction inflation supports values.
While appreciation rates may normalize from pandemic highs, structural drivers remain intact.
Investor Strategy: Balancing Yield and Growth
Investors in Santa Rosa Beach typically choose among three strategies.
Yield-focused:
Condos or inland LTR properties.
Balanced:
Mid-tier 30A homes.
Appreciation-focused:
Luxury coastal properties.
Portfolio investors often combine all three to optimize total return and risk diversification.
Why Appreciation Matters More in Coastal Investing
In traditional rental markets, appreciation is uncertain and income dominates returns.
In Santa Rosa Beach:
-
Scarcity drives value
-
Lifestyle demand persists
-
Buyer liquidity strong
-
Replacement cost high
These factors make appreciation more predictable over long horizons.
This shifts investor focus from cap rate alone to total return.
Evaluating a Santa Rosa Beach Investment
Sophisticated investors evaluate:
-
Cap rate
-
Appreciation potential
-
Location quality
-
Rental demand
-
Liquidity
-
Risk profile
A property with lower cap rate but superior location often outperforms long-term.
Working With a Santa Rosa Beach Investment Specialist Like Steve Philpot Emerald Coast Realtor
Analyzing cap rate and appreciation in coastal markets requires hyper-local expertise:
-
Rental performance by neighborhood
-
Pricing trends by micro-market
-
STR demand patterns
-
Buyer behavior
-
Future supply constraints
Steve Philpot helps investors identify Santa Rosa Beach properties where cap rate and appreciation combine to maximize long-term portfolio returns.
Frequently Asked Questions About Cap Rates in Santa Rosa Beach
What is a good cap rate in Santa Rosa Beach?
For 30A properties, 3–5% is typical. Inland rentals may reach 5–6.5%.
Why are cap rates lower near the beach?
High demand, limited supply, and appreciation expectations increase prices relative to income.
Do Santa Rosa Beach properties appreciate faster than other Florida markets?
Historically yes, due to coastal scarcity, tourism prestige, and strong buyer demand.
Should investors prioritize cap rate or appreciation?
Successful Emerald Coast investors evaluate total return, combining income and long-term price growth.
Are condos or homes better for cap rate?
Condos often produce higher cap rates, while single-family 30A homes offer stronger appreciation.
About Steve Philpot
Steve Philpot is an Emerald Coast real estate advisor specializing in Santa Rosa Beach and 30A investment properties. He helps investors analyze cap rates, appreciation trends, and acquisition opportunities across the Florida Gulf Coast to build high-performing real estate portfolios.